01
Revenue widget
Closed-won, weighted pipeline, and forecast in one card. Click through to the underlying deals.
Product
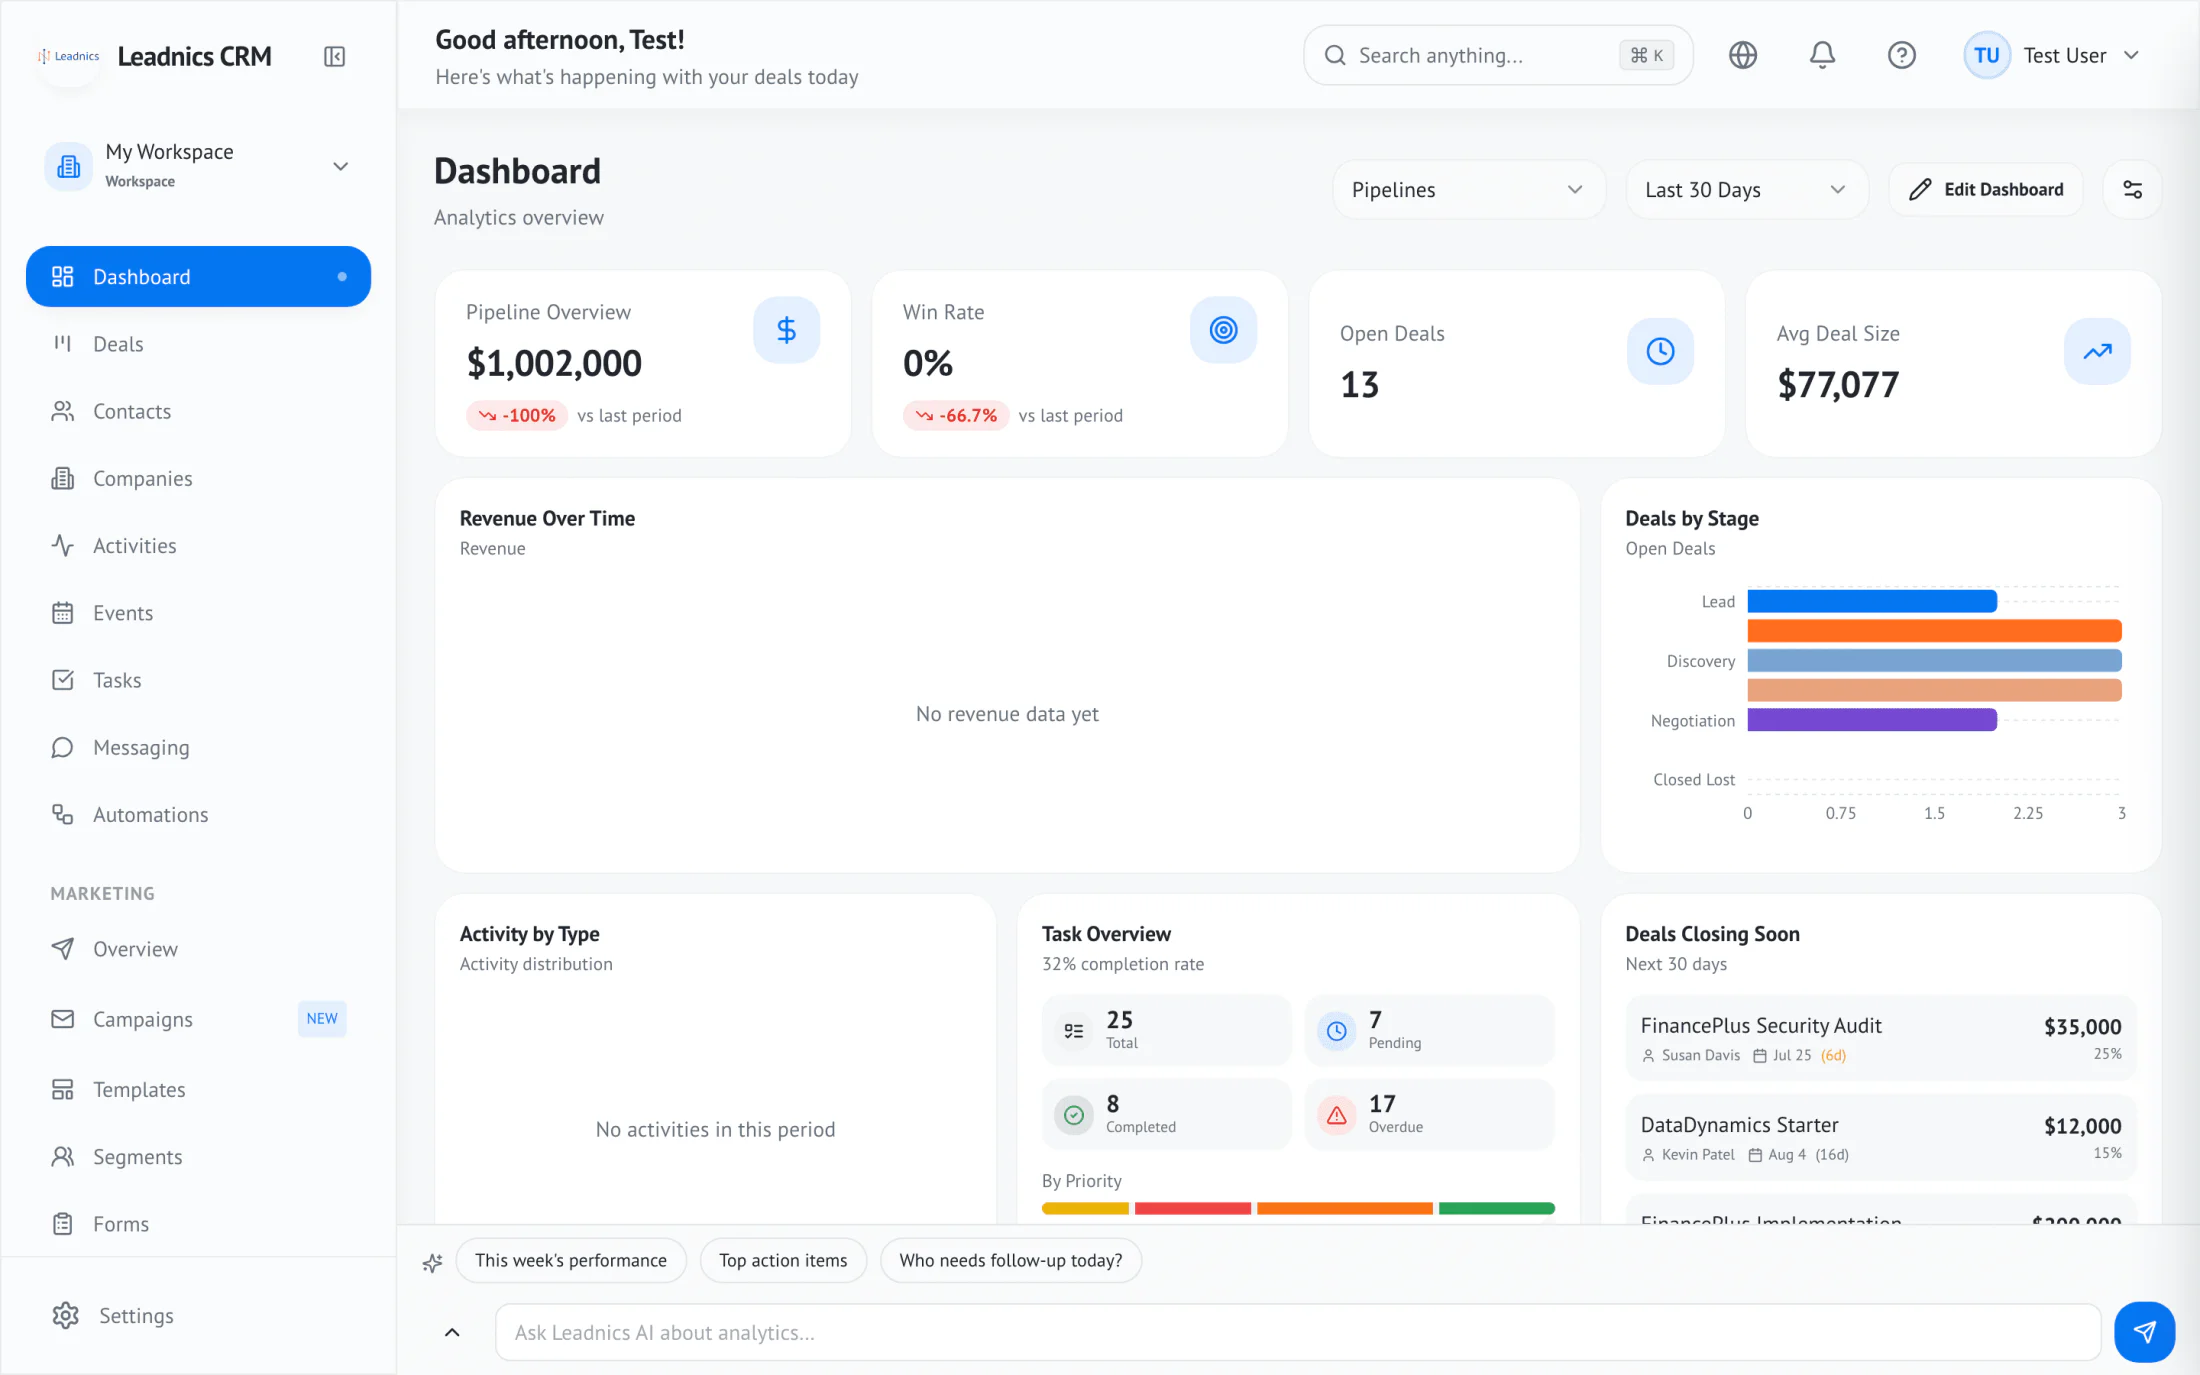
Pipeline coverage, source ROI, rep performance, event attribution — laid out so a sales lead can read it in one glance and a CFO can audit it in one click.
How it works
Pick from 30+ widgets — funnel, cohort, leaderboard, time-in-stage, win/loss — and arrange them on the dashboard grid.
Apply team, time range, segment, or event filters across every widget at once. Save the view, share the link.
Push any chart to CSV, PNG, or a scheduled Slack/email digest. Numbers live where the people who need them already are.
Capabilities
Closed-won, weighted pipeline, and forecast in one card. Click through to the underlying deals.
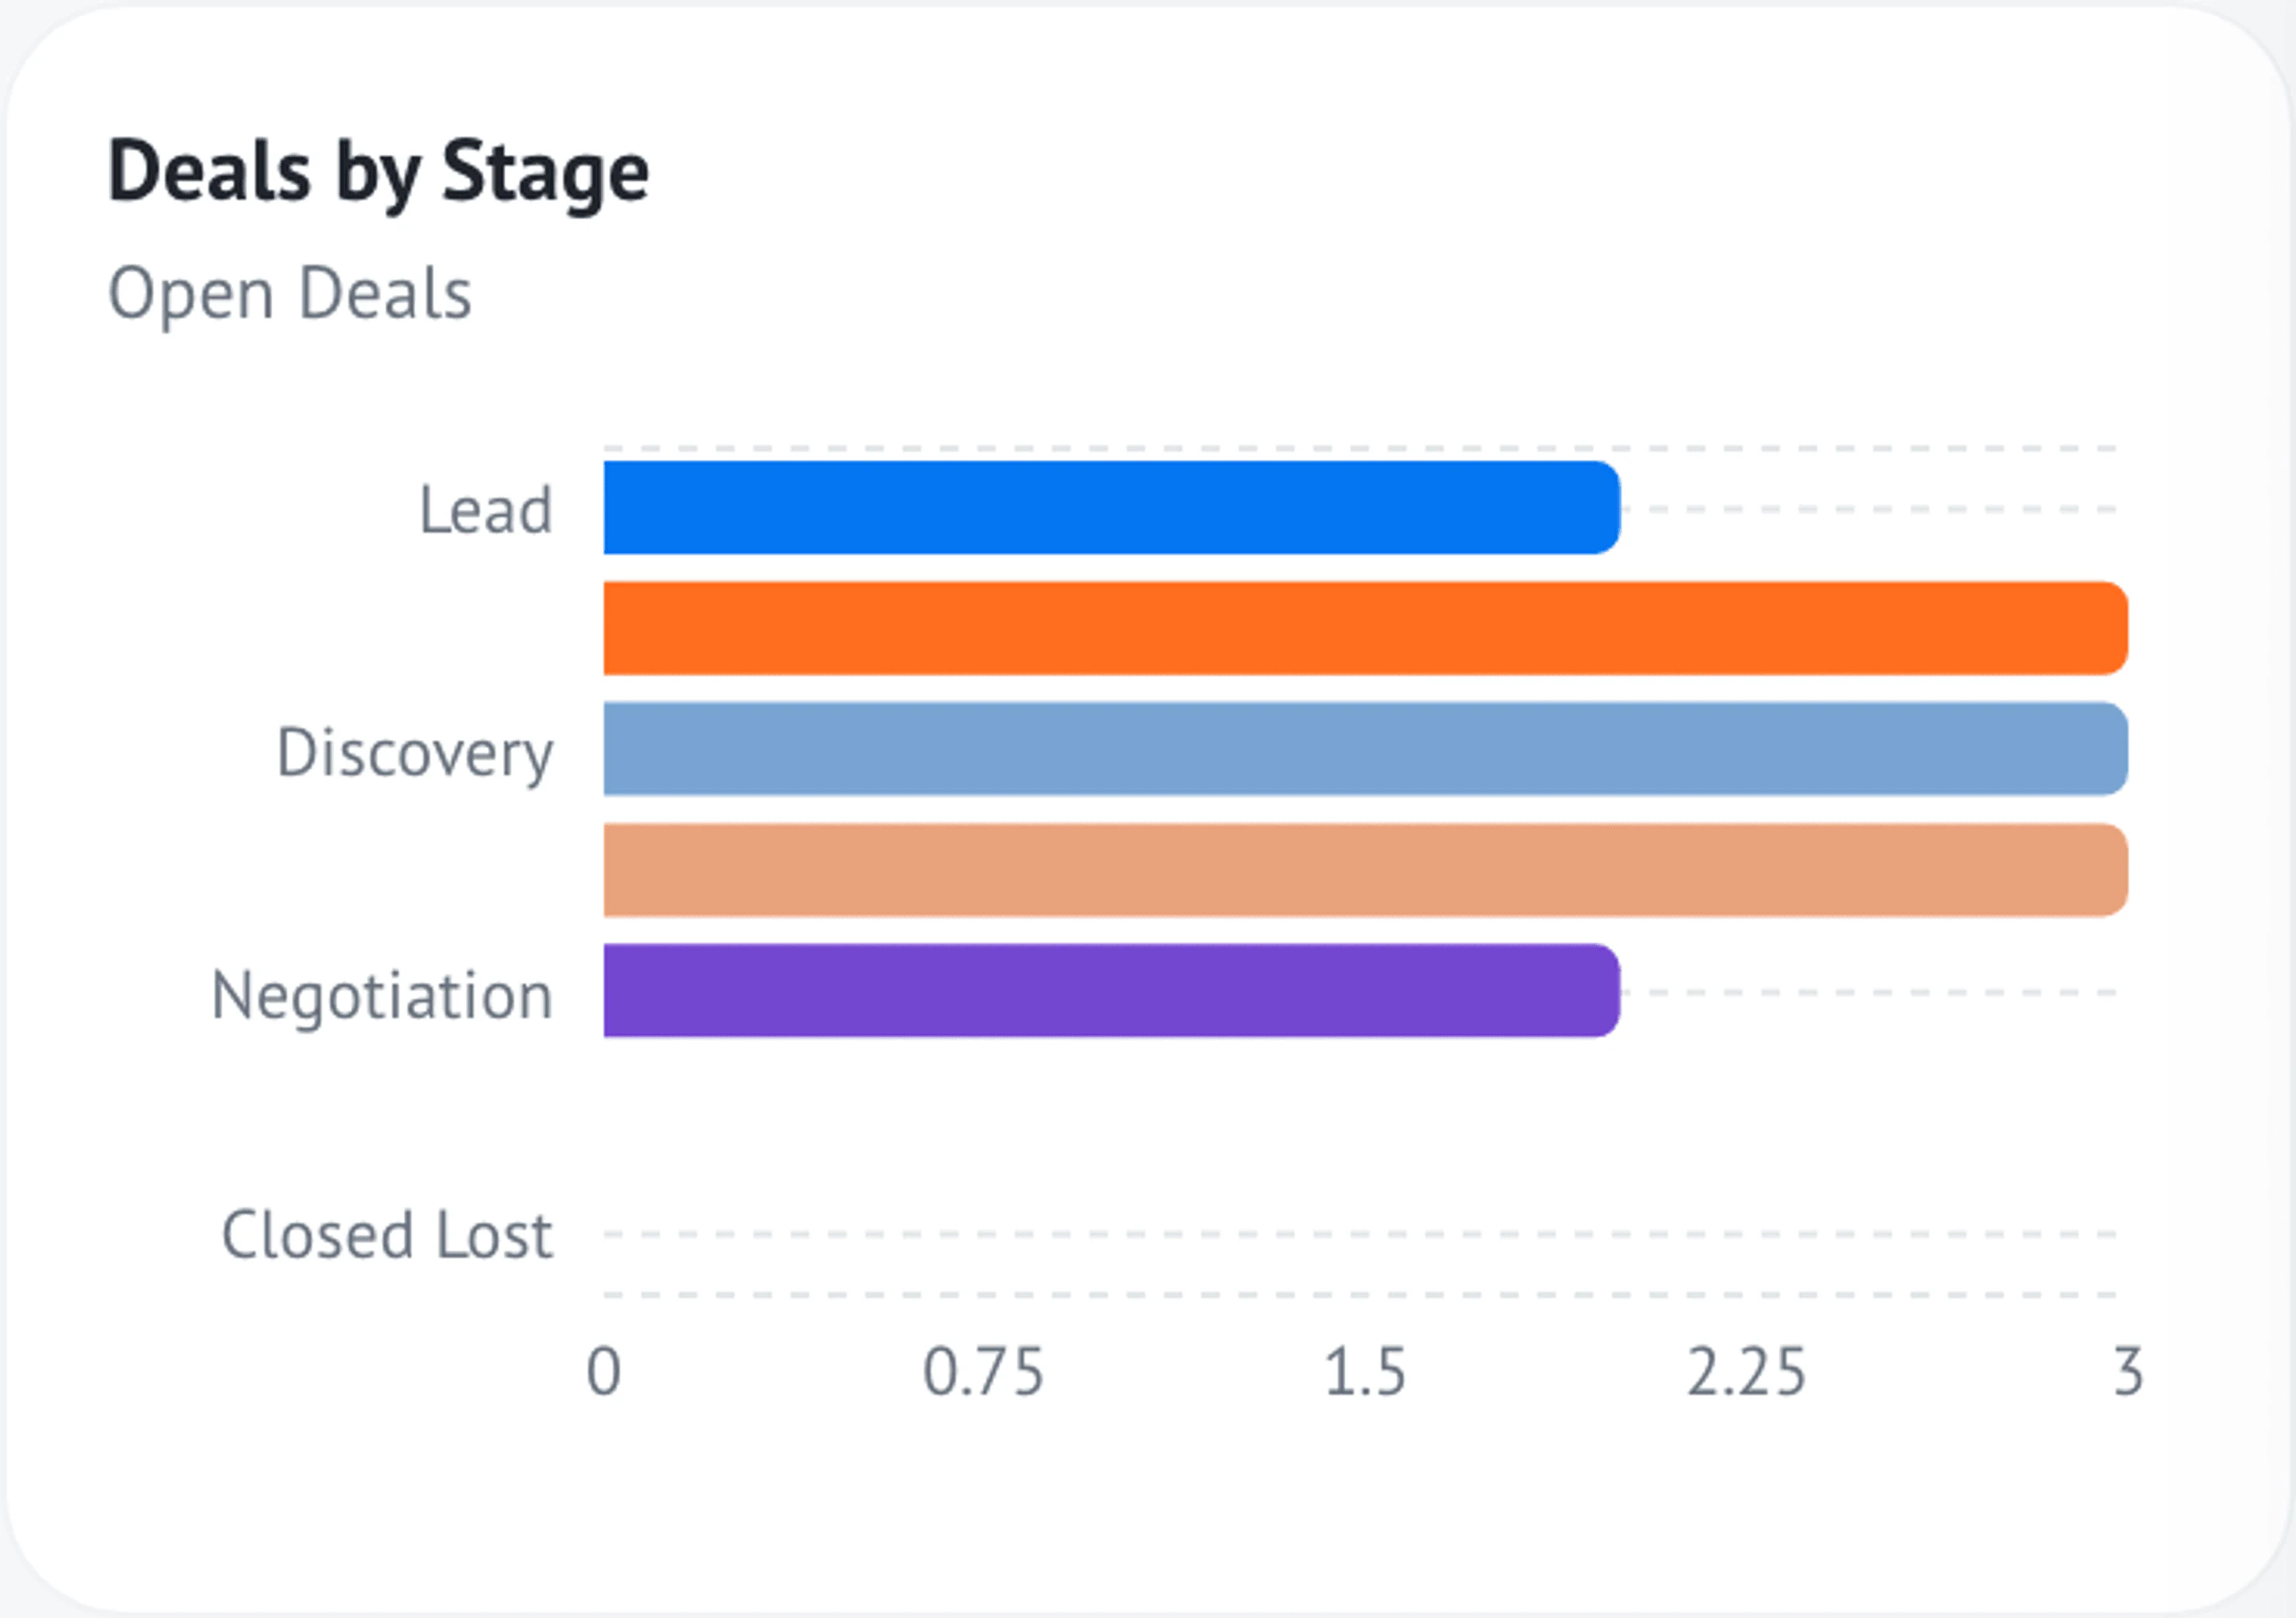
Lead → MQL → SQL → Won, with drop-off per stage and average time between stages.
Where deals slow down, where they accelerate, broken out by rep and segment.

Trade-show vs. webform vs. referral revenue, side by side, with cost-per-lead inputs.
Activity, pipeline, and closed revenue per rep — the same view a sales lead uses on Monday.
Email or Slack snapshot to the team Monday 8am — pipeline movement, won deals, stalled accounts.
Questions
Yes. Pick the data source (deals, contacts, activities), choose a chart type, set filters and grouping. Save it to the library to reuse across dashboards.
Yes. Widgets read straight from the production database, so the numbers are always current.
Yes. A direct read-only Postgres connection ships with paid plans; CSV and scheduled file delivery work on every plan.